

Written by Marianna Adams, Audience Focus, 2014 Educator-in-Residence at the Isabella Stewart Gardner Museum
Cross-posted from mariannaadams.blogspot.com
One of the great luxuries I value about my time here at the Gardner Museum has been the opportunity to have rather leisurely and unstructured conversations with museum educators here and at other museums in the Boston area. I appreciate the value of not always having an agenda and not needing to solve a problem. We bounced ideas off each other and I always came away with a fresh perspective, a deeper conviction in my intuition, and lots of new ideas. Our talks often meander around the relationship between a museum experience or program and how we choose to evaluate it. A few themes have emerged from the conversations so far.
There is Life Beyond the Survey
 Over the years I have not made a secret of how much I don’t like written questionnaires, paper or online, despite how much I end up using them on evaluation projects. Why? The written survey is the most difficult methodology to do well. It’s the default methodology that most people think of when planning an evaluation and most of them are tedious and poorly focused. It’s a blunt instrument that cannot capture much in the way of subtlety and nuance (and life is so much about nuance). In recent years, with the plethora of online survey programs, we are drowning in surveys so survey-fatigue is a reality. Most surveys are really asking for the visitor to tell us that we did a good job (e.g., How satisfied were you with this experience?) and not enough about how the visitor values or benefits from the experience. Besides, the written questionnaire usually does not reflect the spirit of the experience we’re trying to evaluate, bringing me to my next point.
Match the evaluation method to the experience.
Imagine yourself at a museum’s “evening hours” event. There is a great band, wine, engaging activities going on throughout the galleries, good friends, and a happy crowd of people of all types and ages. The atmosphere is both relaxing and energized at the same time. As you stroll towards the door to leave the museum, someone hands you a piece of paper. It’s a survey asking you to evaluate this time you just had and it smacks you out of the pleasant, liminal state you spent several hours dropping into. That’s an example of how the survey methodology is not well matched to the quality of the experience you just had.
So what methodology might better align with the evening program experience you imagined yourself attending above?
First you start with what you want to know and why.
So often we select the methodology before we figure out what we want to know and why. We decide on surveys or focus groups when those may or may not be the best ways to collect the data. Often we collect more data than we know what to do with. Here’s an example that came up in a recent conversation:
Like many art museums, the Gardner offers several community nights with free admission throughout the year and these events are very well attended. Primarily, the Gardner wants to know if these events are indeed attracting people from communities close to the museum. Yes, we could easily get zip code information via a written questionnaire. The problem is that we tend to throw in a lot of other questions that we don’t really need the answer to. The other area of inquiry the Gardner would like to know about revolves around how visitors connect to the museum. So let’s keep those two data points in mind, residence and connection, as we think about how to get useful information.
Think creatively about ways to get that data and match it to the spirit of the experience.
How could we get zip code data and not make people fill out a survey?
Imagine a big map (maybe near the wine bar because most everyone would go there), with zip code areas and neighborhoods clearly identified. Give people a small colorful adhesive file folder dot and invite them to put it on their zip code. It becomes a fun, social activity and, for some reason, people like to find themselves on a map. It’s simple and inexpensive. At the end you have a picture of the zip code distribution of your audience. You could do this for other evening events and compare the maps.
What about the ways visitors connect to the museum?
One methodology that I love to experiment with is embedded performance assessment. This means that visitors don’t realize they are providing evaluation data, even when we tell them, because the process is engaging on it’s own. At a workshop for the Gardner Museum education staff this week, artist-in-residence Paul Kaiser inspired us all to explore new ways to engage visitors and possibly end up with some interesting evaluation data.
 Paul first introduced us to the concept of collaborative writing, using the example of Japanese renga poetry. He then provided us with a set of words — rising, distant, enclosed, fold, release — and asked us to take the spirit of renga into the galleries, substituting the verses for objects, spaces, or views based on that set of words. We did it and were struck by how beautifully the experience honored the spirit of what Mrs. Gardner did in the ways she arranged objects to suggest ideas or relationships.
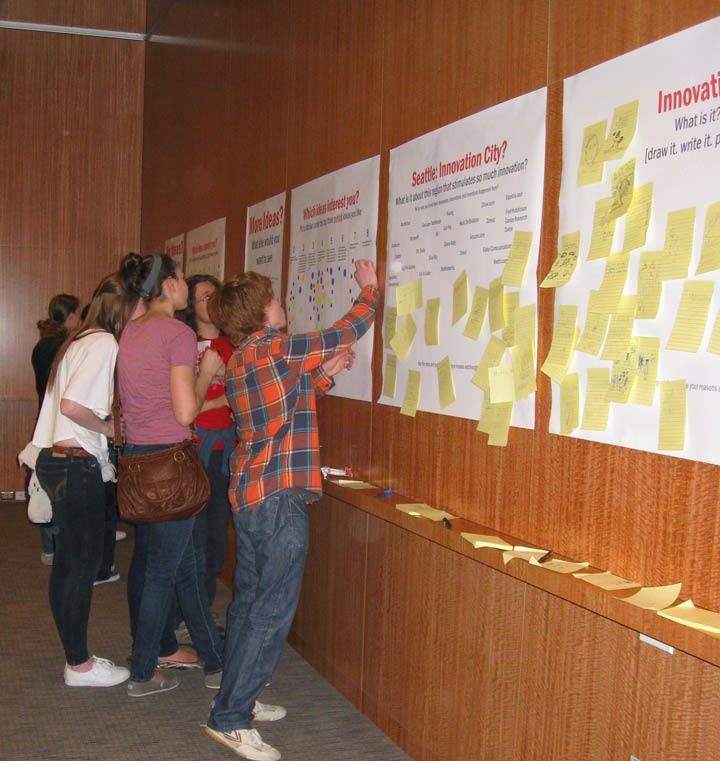
We played with ways to use this activity with visitors, discussing ways to engage families and adult visitors at community nights in something similar. Perhaps if we created a more playful set of words to match the feel of these events, visitors would find it enjoyable. We brainstormed possibly having a place where people could post their responses and read what others thought about. Having these responses could be a rich data source that helps us better understand ways that visitors make connections to the museum. We were jazzed!
What are some unconventional ways that you have collected rich and useful data about the visitor experience?
OTHER POSTS IN THIS SERIES:
Towards a More Mindful Practice
Falling in Love with Your Visitors
Barriers to Family Engagement in Museums
* * * * *
ABOUT AUTHOR
 MARIANNA ADAMS is President of Audience Focus Inc. Her professional roots began in K-12 public and private school teaching (fine art, English literature, social studies, and special education) and segued into museum education where she headed several education departments in Florida museums. She founded Audience Focus Inc., in 2007 after 12 years of conducting evaluation, research, professional development, grant proposal writing, and concept development for the Institute for Learning Innovation. Her degrees are from George Washington University (Ed.D.), University of South Florida (M.A.) and Mercer University (B.A.). In her spare time she is an avid yoga practitioner and teacher.

It’s hard to believe your residency is ending. Time flies! I’ve enjoyed reading your reflections. At the same time, I have been cleaning out old files. I’m struck by how much time and energy we spend trying to justify what we do and how we do it. It seems you’ve been able to step out of the busy-iness and just enjoy the “flow” of the moment with the families. I do think if we spent more time thinking about our outcomes, then the evaluation might be a more natural fit. It would certainly save all the recycling I’m doing of old questionnaires!
Anne,
You are right. What a great image – you in the file cabinets. Yes, this residency has been a true gift. I’m looking forward to seeing how it influences my “real” life.
I love the ideas of embedded and performance assessments. Assessing in the mode we are learning seems so clear and yet… The zip code collection using a map is so great. People do seem to like to find themselves on a map. At the Museum of Science, Boston there is a large wall map of the greater Boston Area with buttons to light up the different areas. It is always a popular spot with visitors.
Other ideas for performance assessment – Many years ago at the Museum of Science, we did a joint study with the Franklin Institute to investigate what middle school students might take away from a non-faciltated gallery experience. The exhibit we used was focused on different surface features of planets and moon. We used a variety of assessment methods. One included asking students to sort picture cards into categories of their choosing. The other gave visitors a board with a thin coating of clay, asking them to create objects using cotton, pop-sticks and additional clay. We looked for connections to the features from the exhibit. Students really enjoyed both of these experiences.
Thank you for all your wonderful posts this summer. I agree with the above comment that we have all gained from your residency.
Marianna, the idea of providing alternate, creative ways to receive feedback from visitors really resonated with me. At the Hammer Museum, we’ve been experimenting with a participatory space we call “the Nook” that has provided us with a lot of food for thought regarding what is of interest to our visitors. In the latest iteration of the Nook, we asked visitors what they would like to share about Los Angeles on a large sprawling map of the city in conjunction with our MADE IN LA 2014 exhibition. Even the responses that could not really be categorized as “feedback” per se were illuminating and revealed quite a lot about what captures the attention of our visitors. A colleague from our Visitor Experience Department and I recently reflected on what we’ve learned in a blog post here: http://hammer.ucla.edu/blog/2014/08/capturing-you-in-la/.
Theresa,
Thank you so much for sharing this link with me. It’s amazing. I love this work.
Perhaps you have already done this but with a response area at LACMA Lab some years ago we sorted the sticky notes into categories: Off-topic (like Joey loves Suzy or Go [fill in sports team]), general positive/negative (e.g., You rock! This is wonderful. We love you. Guards are mean.) and specific responses to the prompt. Then we looked for emerging categories within the specific responses and coded those to see the ways in which people responded to the prompt. If the Off-Topic and general positives out-numbered the on-topic specific responses then it was a big clue that something was amuck – usually with the prompt and/or the visual representation (what it looks like and the materials they get to use to make a response – so your use of the red/white paper and tape is brilliant as it’s both simple and stimulates creativity). At LACMA, we began to tinker with the prompt and posted a new one, then recoded the responses after a period of time (off-topic and general positive/negative responses reduced and on-topic responses increased). Then we played around with the physical look of the space and the materials they used for their response. The on-topic responses went way up. So the prompt and the visual qualities matter in equal degree.
Great idea and thanks for sharing it with me!