
Written by Juline Chevalier
I keep thinking of the start of this post like the set-up for an uninspired stand-up comedy routine.
Me: Wow, it’s been a bad year for museum education!
Audience in unison: How bad is it?
Me: We did a survey to find out … let me tell you about it.
Not much of a punchline, I know.
We all know it’s been bad, and I am so sick of the use of phrases like “unprecedented” and “difficult year for everyone.” Because it hasn’t been equally difficult for everyone in the museum field.
This snapshot of findings from a survey by AAM and Wilkening Consulting showed that the staff positions most affected by layoffs and furloughs due to COVID19 were Guest Services/Admissions/Front of House/Retail (68%) and Education (40%).
So, how bad is it?
In the spring of 2020, Stephanie Downey and Amanda Krantz from arts and culture evaluation firm RK&A reached out to me in my role as Director of the Museum Education Division of the National Art Education Association (NAEA). They offered their services pro bono to document the impact of COVID19 on the museum education field. Stephanie and Amanda worked with the Museum Education Division on the Impact Study of Facilitated Single-Visit Art Museum Programs on Students Grades 4–6 and are truly committed to the field. Stephanie has written on this blog reflecting on the impact of COVID19 on museum relationships with K-12 teachers, students, and programs. Amanda has similarly cautioned that reducing education staff in museums weakens connections to community.
Stephanie and Amanda helped us create a digital survey that we distributed via email, social media, and listservs. Responses were collected in from August to October 2020, with most of the responses collected in September. Amanda analyzed the results of the quantitative questions, and Gwendolyn Fernandez and I analyzed the responses to a few open-ended questions. Gwen is the Pacific Region Representative-Elect for the NAEA Museum Education Division.
We shared an overview of the results in a webinar that you can watch a recording of here.
Of the 330 people who answered a question about change in employment status from the end of 2019 to the time of the survey, 66% said their employment status did not change. 30% reported some kind of negative impact such as being furloughed, pay or hours being cut, or being laid off. Percentages can gloss over the human beings impacted by these huge changes in their lives. 30% of 330 is 99. So 99 people who responded to the survey had to deal with the stress of a global pandemic plus decreased income or job security.
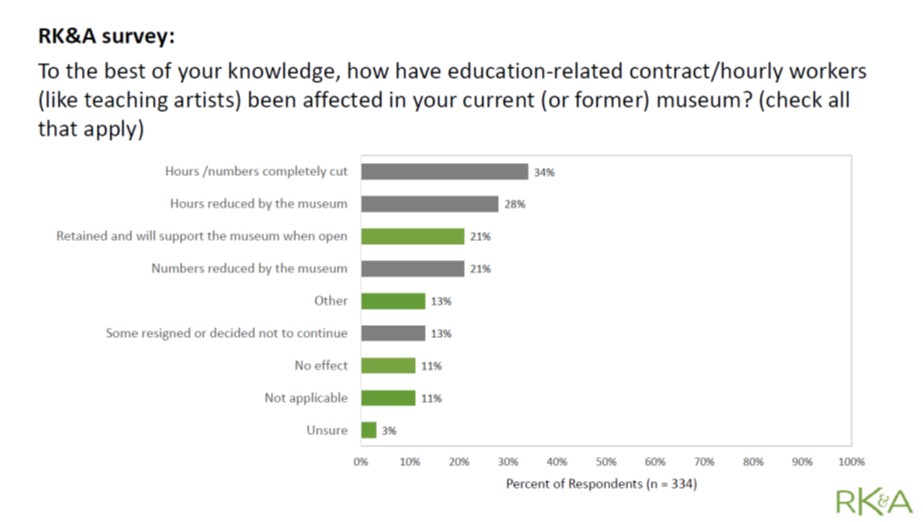
41% of respondents said that there was a decrease in full-time, or full-time equivalent, employees in their education departments between the end of 2019 and fall 2020. 54% said there was no change. Of course, full-time employment in museum education can seem like a luxury to the many folks who work on a contract or hourly basis. 34% of respondents said that the contract/hourly workers at their institution had been completely cut (see chart below).
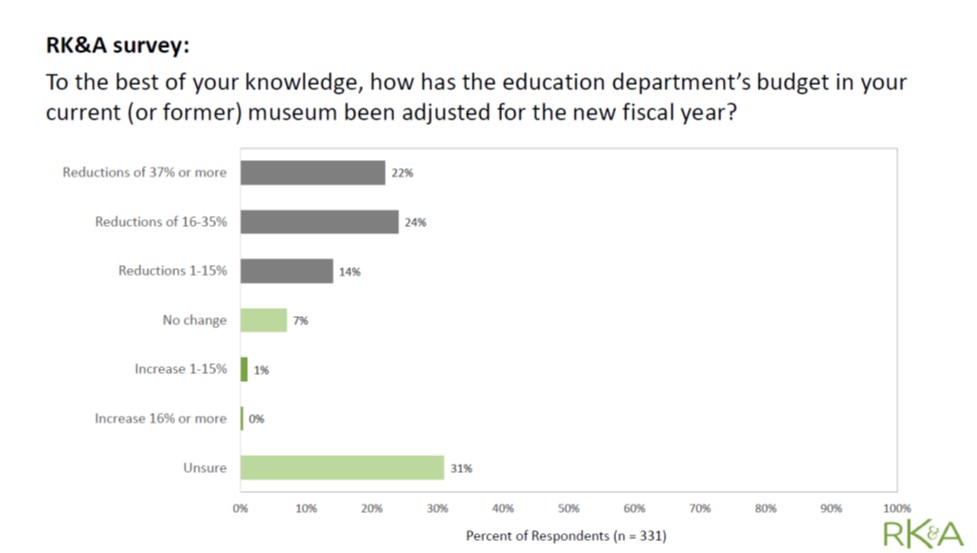
Education department budgets also took a hit. 22% of respondents said their department budgets were reduced by 37% or more. 24% of respondents said their budgets were reduced between 16 and 35%. See chart below.
Museums have generally not been asking volunteers and/or docents to perform the work of previously employed museum staff. 81% said that volunteers were not asked to do work that had previously been done by paid staff.
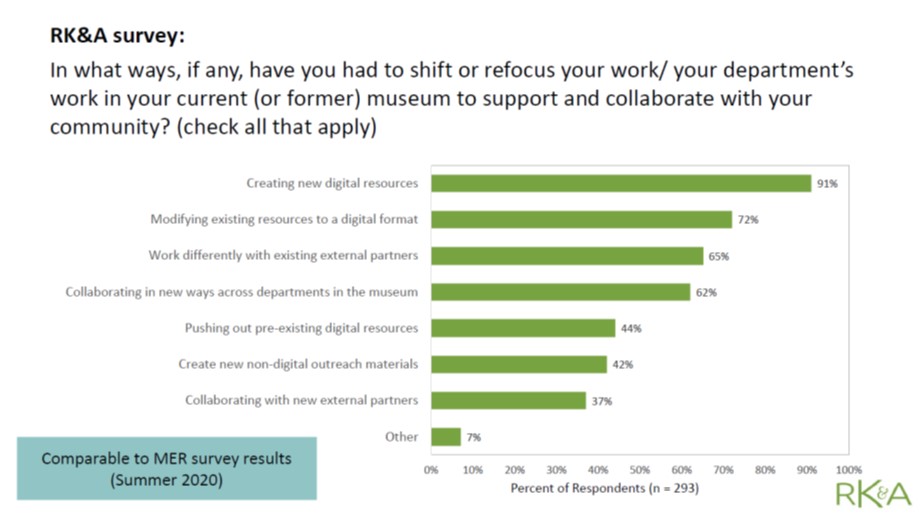
Of course, the work shifted to digital and online formats: 91% of respondents said that their work shifted to creating new digital resources, and 72% said they were modifying existing resources for a digital format (see chart below).
Of the 246 responses to the open-ended question “What are you most proud of when it comes to the work you have been doing during the pandemic?” the most responses (110) mentioned digital or virtual programs and resources.
The work is still getting done, just with fewer staff and less budget. For the staff that remain, being stressed and overwhelmed is a common feeling. Of the 245 responses to the open-ended question “What is the most pressing concern you face in regard to work right now?” 52 responses identified increased workload and 44 responses described stress.
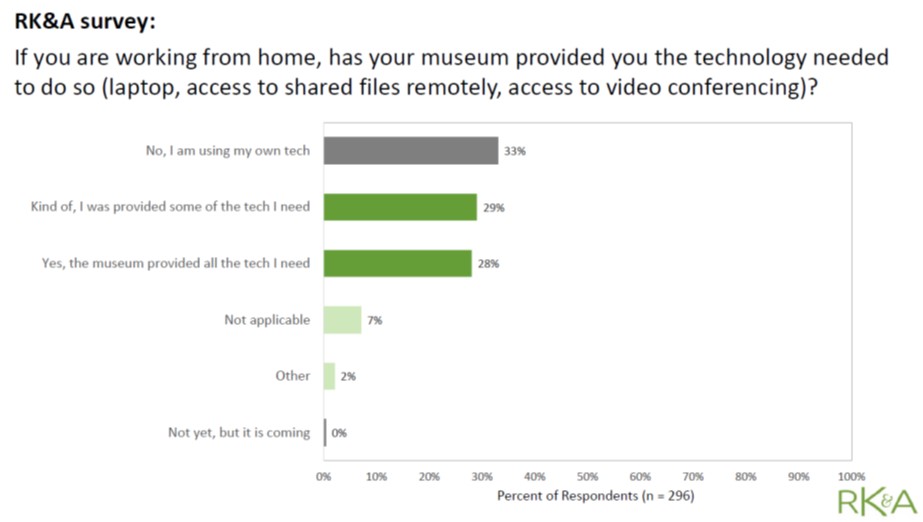
Huge amounts of digital and virtual work is happening, but education staff have not been provided the tools they need to complete this work. One third of respondents (see chart below) said that they were using their own technology (laptop, etc.) to work from home. 29% said their museum provided some of the technology they needed, but not all.
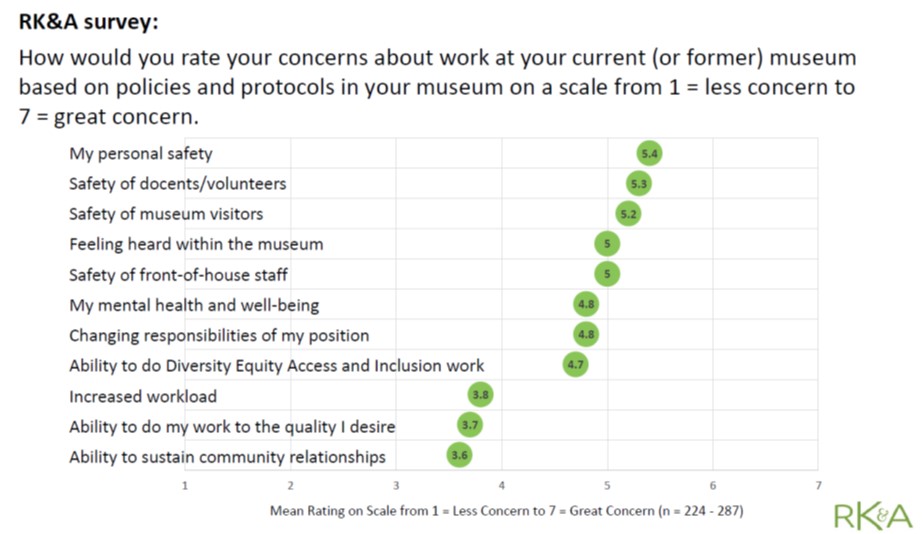
Museum educators are an empathic bunch; the chart below shows they reported being very concerned about their own safety and the safety of other staff, volunteers, and visitors. In response to the open-ended question “What goals do you have for pivoting your work through the remainder of the year?” two of the top five types of responses were “internal support” and “self-care” which acknowledge this increased emotional labor.
The category of “internal support” centered on retaining and supporting staff, leading with care, collaborating and communicating well, advocating for the education department, and creating sustainable cultures of productivity. The category of “self-care” is characterized by work/life balance, drawing boundaries, protecting against burnout, and managing expectations. Burnout is a concern for many museum educators in “normal” circumstances, but COVID19 has created a perfect storm of larger workload, decreased resources, and additional stress.
I am especially concerned that when in-person visits are common again that museum education staff will be expected to continue with the extraordinary digital offerings that they’ve developed and bring in-person tours and programs back to pre-COVID19 levels.
How is half the staff supposed to do twice the work? I implore you to start managing expectations of your department and museum leadership now. Consider what your priorities are and ask leadership what theirs are. Create a plan of action that takes into full account the resources you have. You might even compare what would have been possible with the staffing you used to have compared to what you have now.
I will end with the encouragement and reminder to focus on self-care and your mental and emotional well-being. We cannot expect things to go “back to normal,” nor should we want that.
If you are able to join us for the NAEA Museum Education Virtual Preconference on Feb. 23 and Feb. 25, 2021, you can explore the theme of Centering Care in Art Museum Education. Registration for the preconference is $49 for members and nonmembers.
We’re excited to welcome Tricia Hersey, founder of The Nap Ministry as the keynote speaker. Tricia Hersey is an artist and activist. From the Nap Ministry website:
“Rest is a form of resistance because it disrupts and pushes back against capitalism and white supremacy.”